When server admins ask for help on forums or Discord groups, the first response is always: "Run /spark profiler and post your link!" But when you open a Spark report for the first time, you are greeted by hundreds of nested Java call stacks, complex thread flame graphs, and cryptic class names like net.minecraft.world.entity.LivingEntity#tick. In this detailed guide, I will teach you how to read Spark profiler reports like a seasoned Linux systems administrator and fix the exact root cause of your lag.
TPS vs. MSPT: The Two Vital Signs of Server Health
Before analyzing flame graphs, you must understand the distinction between TPS and MSPT:
- TPS (Ticks Per Second): The target speed is 20.0 TPS. In Minecraft, 1 second is divided into 20 game ticks (each tick duration = 50ms). If TPS drops below 20.0, time slows down in game.
- MSPT (Milliseconds Per Tick): This measures how long the CPU took to calculate a single game tick. As long as MSPT stays under 50.0ms, your server will maintain a solid 20.0 TPS. If MSPT rises to 75ms, TPS drops to 13.3.
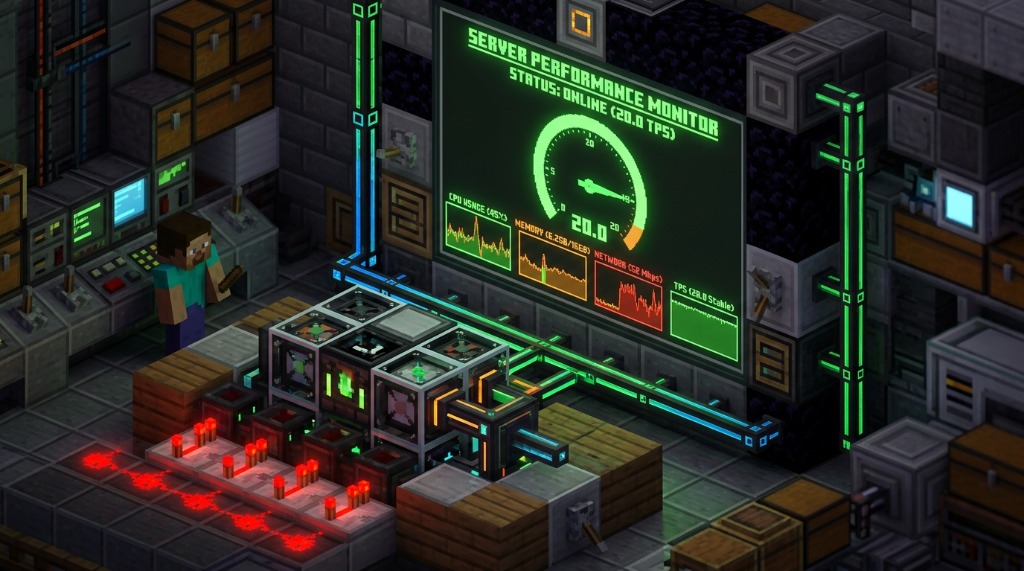
Diagnosing the Top 4 Lag Culprits in Spark Flame Graphs
1. Entity Ticking Bottlenecks (ServerLevel#tickEntities > 40%)
If tickEntities dominates your CPU flame graph, mobs and villagers are choking your main thread. In particular, villager brain pathfinding (Villager#tick) and large hopper item sorter arrays are notorious for high MSPT load.
Fixes: Install Lithium on Fabric or tune entity-activation-range in Paper.yml. Lower villager tick frequency in paper-world-defaults.yml.
2. Chunk Generation & Elytra Flying (ChunkProviderServer > 30%)
When players fly at high speed into unexplored territory, the server CPU stalls generating noise terrain and saving region files to disk.
Fixes: Pre-generate your world border using the Chunky plugin before opening your server to players. This eliminates real-time chunk generation completely!
3. Redstone Clock Spam (RedstoneWireBlock#onPlace)
Vanilla redstone updates trigger recursive lighting and block update recalculations across chunk borders.
Fixes: Install the Alternate Current mod/plugin to replace vanilla redstone propagation with an optimized O(1) queue.
4. Garbage Collection (GC) Stalls
If your TPS drops to 10.0 every 30 seconds for a split second and recovers, Java Garbage Collection is freezing the main thread to clean RAM.
Fixes: Apply tuned G1GC Aikar JVM start flags to optimize heap memory allocation.
Generate optimized start scripts for Windows (.bat) and Linux (.sh) servers with our Server Start Script Generator!
Capture a report while the lag is happening
- Reproduce the slowdown with the normal player load. A quiet server produces a clean report that does not explain the incident.
- On current Paper servers, run
/spark profiler start --timeout 600. For short spikes, use/spark profiler start --only-ticks-over 100 --timeout 300. - Open the returned report and confirm the profile covers the time when MSPT increased.
- Start at the server thread, expand the widest branch, and follow the largest children until the report identifies a plugin, entity subsystem, chunk task or garbage-collection pattern.
- Change one setting or plugin at a time, restart if required, and capture a second report under the same load. A fix is only confirmed when the same workload produces lower MSPT.
Do not optimize from percentages alone
A wide branch is evidence about where sampled time was spent, not automatic proof that the named method is defective. Chunk generation can dominate because players are exploring; entity ticking can dominate because a farm is active. Check the server log, player activity and report time window before removing plugins or changing gameplay.